About Me
My name is Marc Brooker. I've been writing code, reading code, and living vicariously through computers for as long as I can remember. I like to build things that work. I also dabble in machining, welding, cooking and skiing.I'm currently an engineer at Amazon Web Services (AWS) in Seattle, where I work on databases, serverless, and serverless databases. Before that, I worked on EC2 and EBS.
All opinions are my own.
Links
My Publications and Videos@marcbrooker on Mastodon @MarcJBrooker on Twitter
Surprising Economics of Load-Balanced Systems
I have a system with c servers, each of which can only handle a single concurrent request, and has no internal queuing. The servers sit behind a load balancer, which contains an infinite queue. An unlimited number of clients offer c * 0.8 requests per second to the load balancer on average. In other words, we increase the offered load linearly with c to keep the per-server load constant. Once a request arrives at a server, it takes one second to process, on average. How does the client-observed mean request time vary with c?
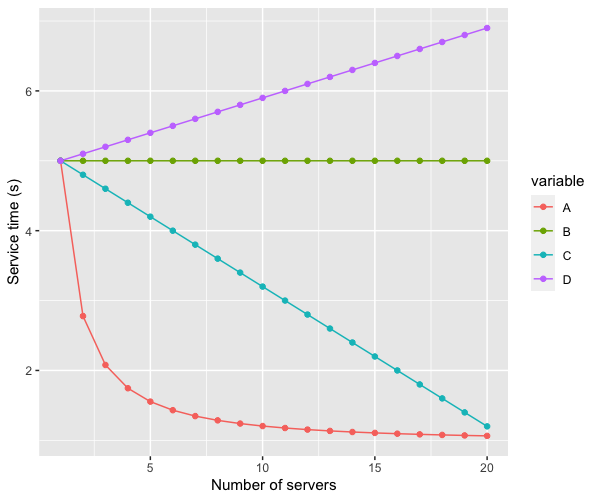
Option A is that the mean latency decreases quickly, asymptotically approaching one second as c increases (in other words, the time spent in queue approaches zero). Option B is constant. Option C is a linear improvement, and D is a linear degradation in latency. Which curve do you, intuitively, think that the latency will follow?
I asked my Twitter followers the same question, and got an interestingly mixed result:

Breaking down the problem a bit will help figure out which is the right answer. First, names. In the terminology of queue theory, this is an M/M/c queuing system: Poisson arrival process, exponentially distributed client service time, and c backend servers. In teletraffic engineering, it’s Erlang’s delay system (or, because terminology is fun, M/M/n). We can use a classic result of queuing theory to analyze this system: Erlang’s C formula E2,n(A), which calculates the probability that an incoming customer request is enqueued (rather than handled immediately), based on the number of servers (n aka c), and the offered traffic A. For the details, see page 194 of the Teletraffic Engineering Handbook. Here’s the basic shape of the curve (using our same parameters):

Follow the blue line up to half the saturation point, at 2.5 rps offered load, and see how the probability is around 13%. Now look at the purple line at half its saturation point, at 5 rps. Just 3.6%. So at half load the 5-server system is handling 87% of traffic without queuing, with double the load and double the servers, we handle 96.4% without queuing. Which means only 3.6% see any additional latency.
It turns out this improvement is, indeed, asymptotically approaching 1. The right answer to the Twitter poll is A.
Using the mean to measure latency is controversial (although perhaps it shouldn’t be). To avoid that controversy, we need to know whether the percentiles get better at the same rate. Doing that in closed form is somewhat complicated, but this system is super simple, so we can plot them out using a Monte-Carlo simulation. The results look like this:

That’s entirely good news. The median (p50) follows the mean line nicely, and the high percentiles (99th and 99.9th) have a similar shape. No hidden problems.
It’s also good news for cloud and service economics. With larger c we get better latency at the same utilization, or better utilization for the same latency, all at the same per-server throughput. That’s not good news only for giant services, because most of this goodness happens at relatively modest c. There are few problems related to scale and distributed systems that get easier as c increases. This is one of them.
There are some reasonable follow-up questions. Are the results robust to our arbitrary choice of 0.8? Yes, they are1. Are the M/M/c assumptions of Poisson arrivals and exponential service time reasonable for typical services? I’d say they are reasonable, albeit wrong. Exponential service time is especially wrong: realistic services tend to be something more like log-normal. It may not matter. More on that another time.
Update: Dan Ports responded to my thread with a fascinating Twitter thread pointing to Tales of the Tail: Hardware, OS, and Application-level Sources of Tail Latency from SoCC’14 which looks at this effect in the wild.
Footnotes
- Up to a point. As soon as the mean arrival rate exceeds the system’s ability to complete requests, the queue grows without bound and latency goes to infinity. In our case, that happens when the request load exceeds
c. More generally, for this system to be stableλ/cμmust be less than 1, whereλis the mean arrival rate, andμis the mean time taken for a server to process a request.
Marc Brooker
The opinions on this site are my own. They do not necessarily represent those of my employer.
marcbrooker@gmail.com